Urban Energy & Green Tech Aliera Platform Live Proof of Concept

MASEMO

Multi-Agent Smart Energy Management & Optimisation

The decision layer for the power grid. MASEMO sits above the data a grid already produces — smart meters, SCADA, billing, GIS — and turns it into ranked, holistic decisions: where to act, what it saves, and what it costs to wait.

US$300,000 of development behind a live proof of concept · presented at ministerial level to national government energy organisations · invited by the Asian Development Bank to present at the Asia Clean Energy Forum 2025.
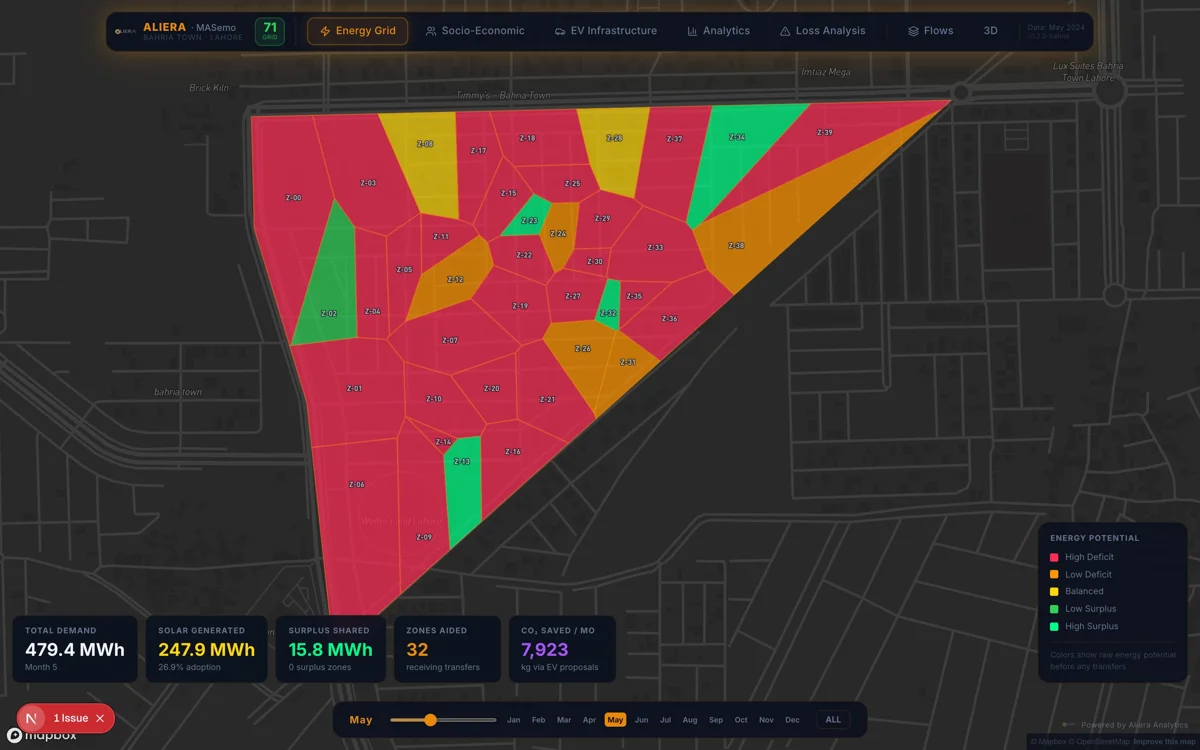
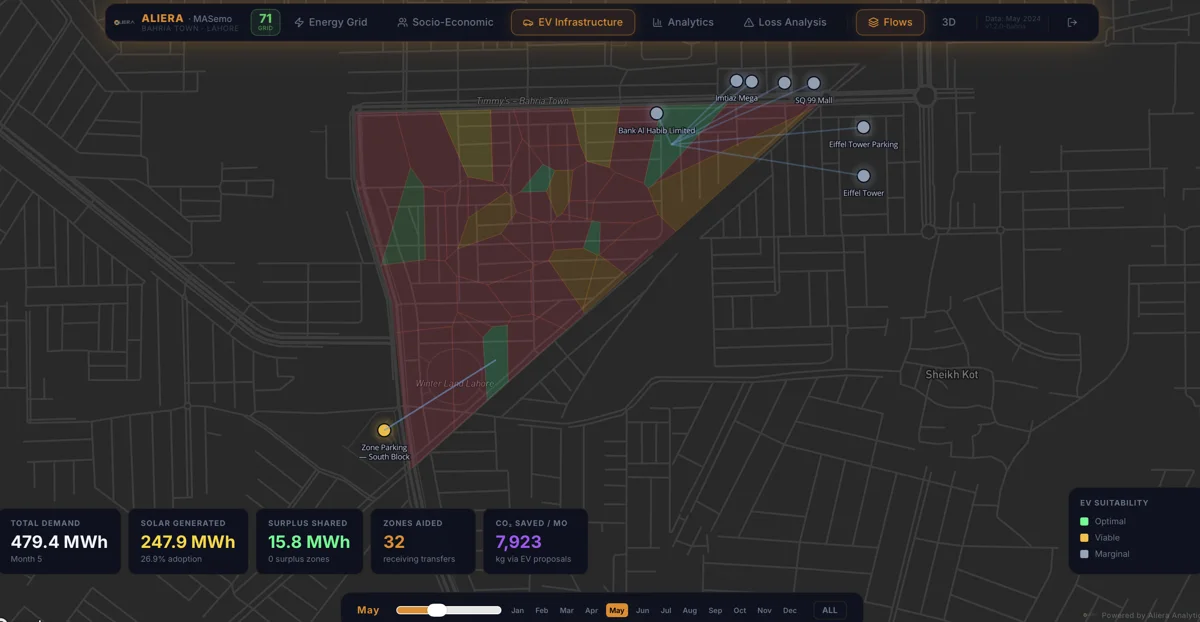
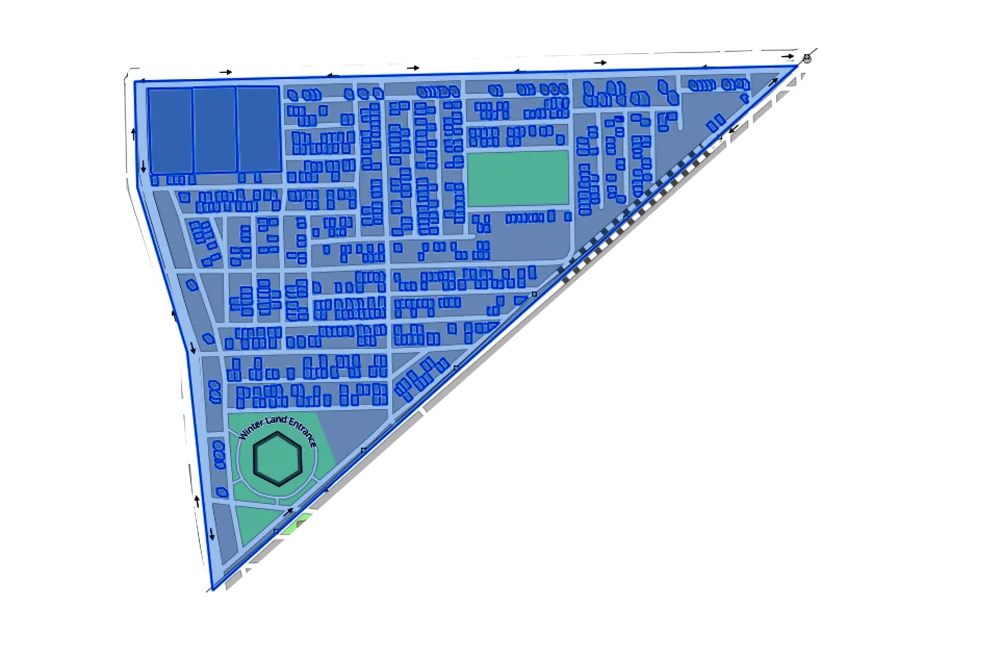
MASEMO zone energy map — demand and generation balance per urban zone

Data tells you what happened. It doesn't tell you what to do next.

Grids can see. Smart meters, SCADA, GIS — a decade of investment in instrumenting networks means the data exists and flows.

But seeing is not deciding. More sensors mean more data arriving at a human who must still decide alone — usually after the problem has built.

The missing piece isn't a sensor — it's a brain. A layer that turns all that data into ranked action: zone-by-zone demand balance, loss anomalies, solar surplus, and 72-hour predictive load forecasts.

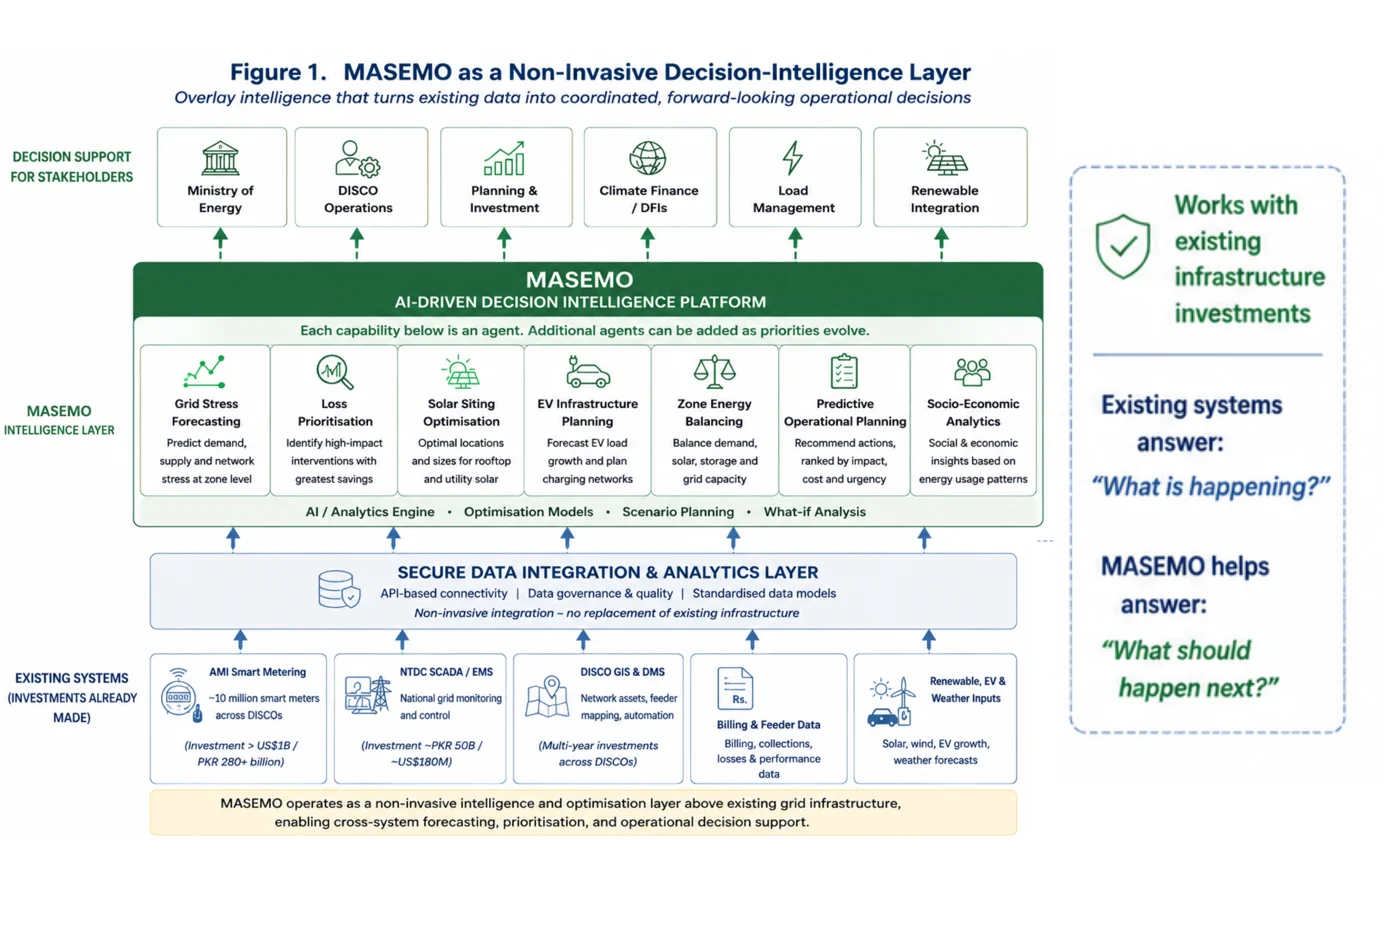
MASEMO as a non-invasive decision-intelligence layer over existing grid data infrastructure
Non-invasive by design: existing systems answer "what is happening?" — MASEMO answers "what should happen next?"

One platform. Eight AI modules. Any city, any scale.

MASEMO doesn't replace grid investments — it increases their operational value through forecasting, prioritisation, and decision intelligence.

Zone Energy Mapping

Demand vs. generation balance for every zone — surplus and deficit zones identified and continuously updated.

AI Solar Siting

Satellite imagery and shadow analysis rank every rooftop and land parcel by solar viability before installation.

EV Infrastructure AI

Road network, traffic density, and zone surplus combined to rank optimal EV charger locations with road-level precision.

Grid Stress Forecasting

72-hour predictive model flags demand spikes before they become load-shedding — early warning for operators.

Energy Loss Detection

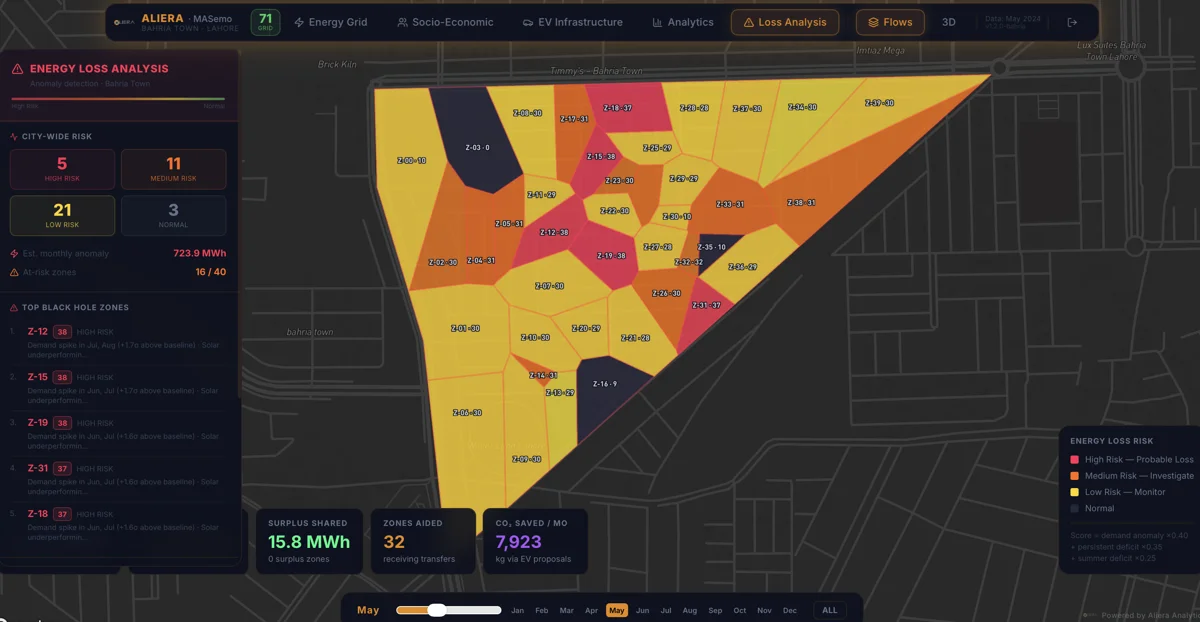
Anomaly scoring identifies meter bypassing, infrastructure leakage, and solar underperformance — zone by zone.

Microgrid Feasibility

Commercial-corridor ROI analysis: payback period, load sizing, and revenue projections for distributed energy.

BESS Integration & Dispatch

Battery energy storage brought into the same decision layer: AI-driven siting and sizing, midday solar surplus absorption, peak shaving, and dispatch optimisation across zones.

Socio-Economic Intelligence

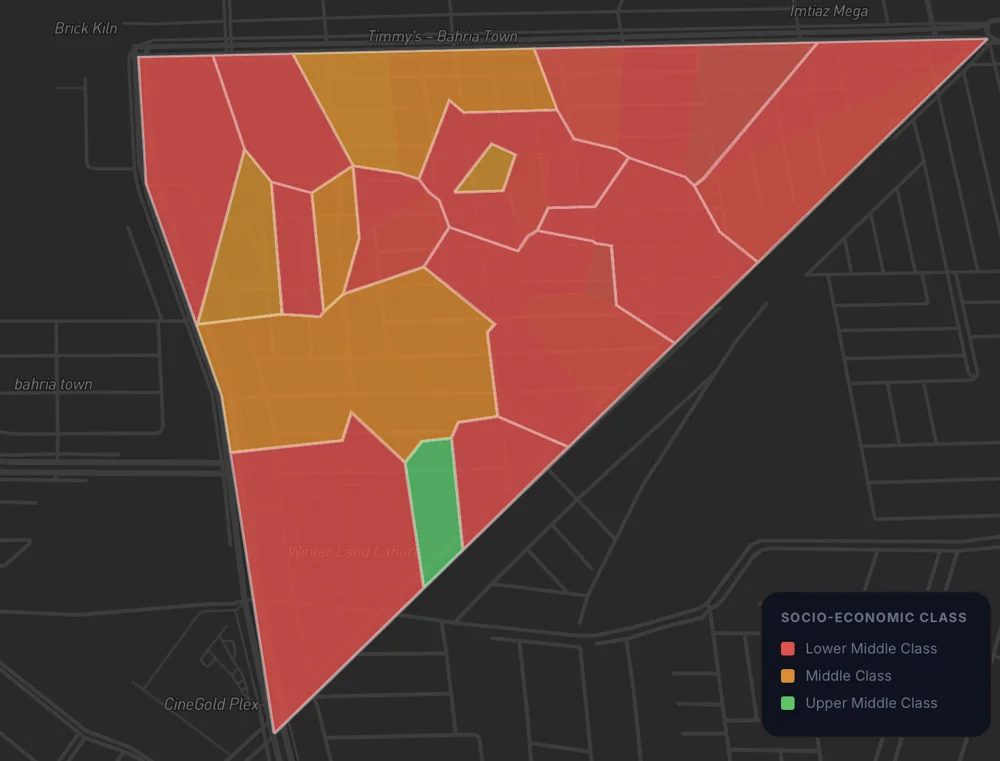
Energy-use and generation patterns segmented by zone demographics — linking demand, buying power, and infrastructure planning.

We didn't just design this. We built it and deployed it.

A live proof of concept runs on a large private urban development in Lahore — built from actual billing records, GIS boundaries, and satellite data. Not modelled. Computed. Coverage has since grown to 71 urban zones in platform v1.0.

71
Urban zones now mapped (v1.0)
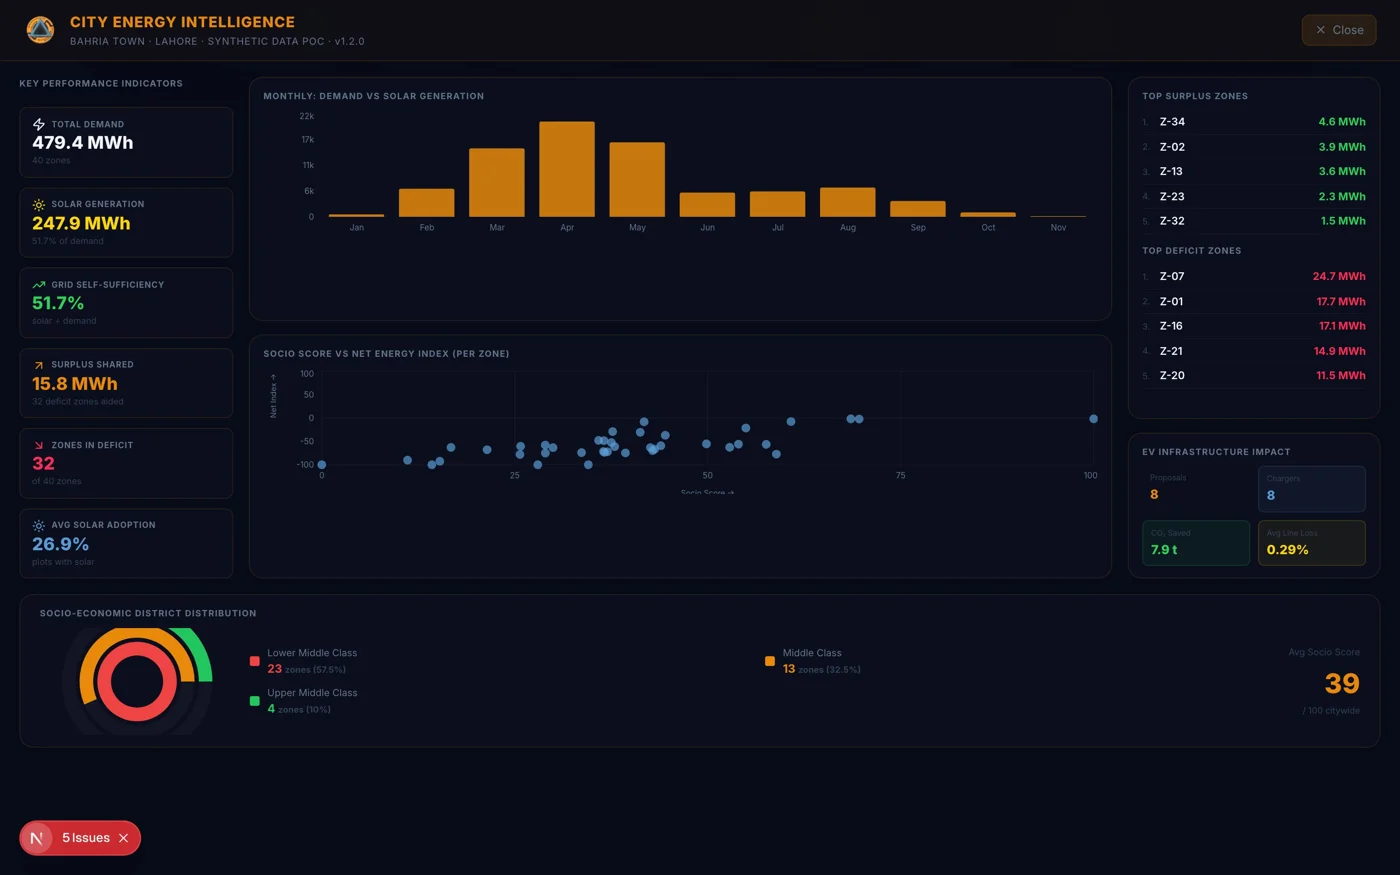
479 MWh
Monthly demand tracked in PoC
51.7%
Grid self-sufficiency (solar vs demand)
16/40
PoC zones AI-flagged as loss-risk
8
Optimal EV sites ranked on corridors
MASEMO city energy intelligence dashboard showing demand, solar generation, self-sufficiency and adoption rate
The city energy intelligence dashboard — every data point computed from actual billing and GIS records.
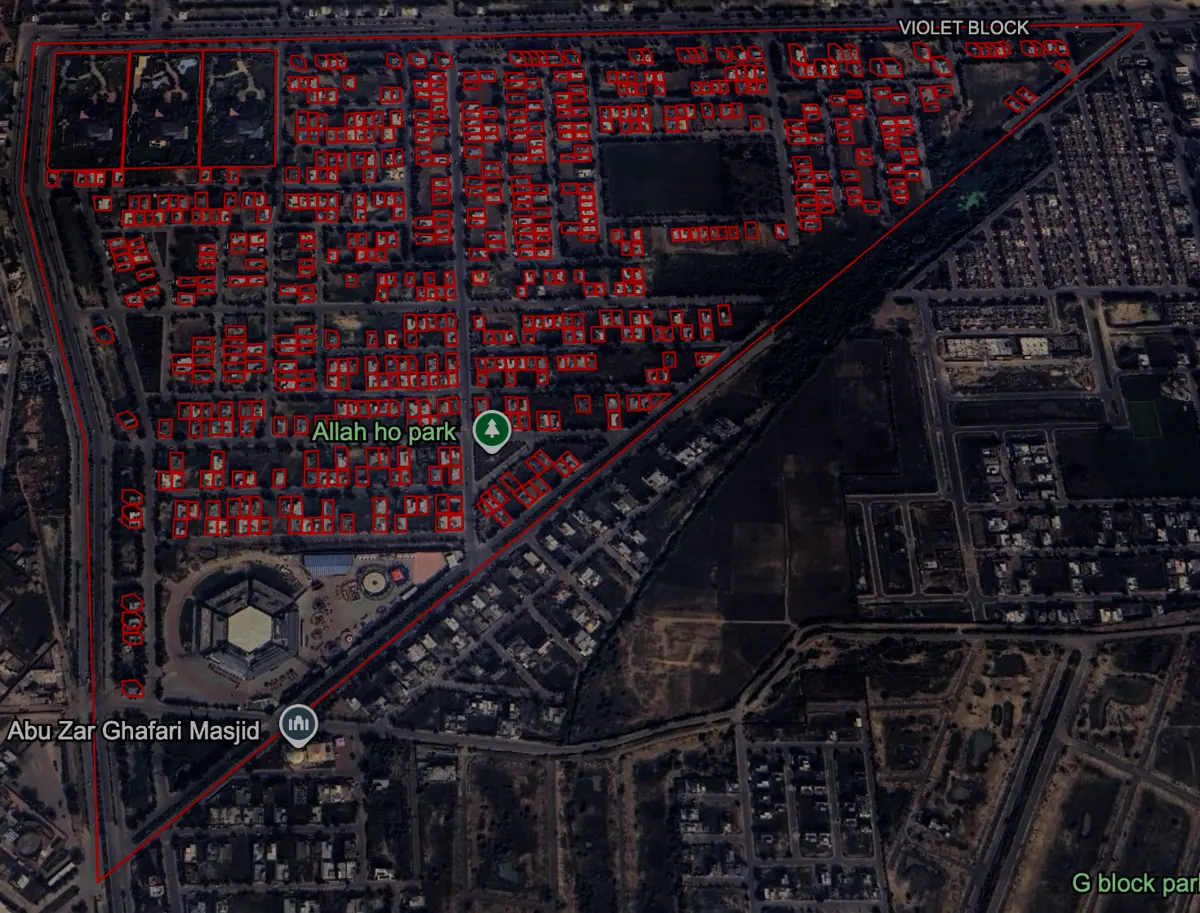
Satellite AI rooftop detection identifying installed solar panels across an urban block
Satellite + AI rooftop detection — finding the solar the registry never captured.
Energy loss detection map with anomaly-flagged zones
Loss forensics: anomaly scoring flags the zones an operator cannot see.
Socio-economic zone segmentation map correlating energy use with demographic classes
Socio-economic segmentation — correlating energy use and solar adoption with likely vehicle types and EV charging demand.

See MASEMO running.

MASEMO live dashboard preview
Online demo — coming soon

The deployed MASEMO dashboard will be accessible here. In the meantime, request a walkthrough and we'll drive.

Request a Demo →

The same decision layer, now proposed for gas.

Gas networks pay for blind spots in pressure. A bulk consumer nominates 400 units, burns 315 — and the 85 unaccounted units don't disappear, they become line-pack pressure. Multiplied across every consumer, every day, that's not a metering problem. It's a prediction problem.

MASEMO's gas configuration extends the same intelligence to gas networks: a non-invasive, modular agent layer over the GIS, metering, and SCADA systems a national transmission & distribution utility already runs.

1

Forecasting Agent

Predicts actual offtake per consumer — the number the nomination should have been.

2

Pressure / Line-Pack Agent

Flags imbalance and pressure build-up early, so curtailment becomes the exception.

3

Loss / Anomaly Agent

Surfaces the losses meters miss — theft, drift, faulty measurement — feeder by feeder.

4

Maintenance Agent

Predicts station and compressor issues before they become outages.

Seeing the grid before we solarize it.

Rooftop solar is growing faster than grids can track — panel imports run at multiples of what registries capture, and feeders built for one-way power now take reverse flow at midday. In a concept developed with a national grid operator, MASEMO extends into locational hosting-capacity and pricing intelligence: a live, block-by-block map of how much more solar each feeder can safely take — and what to do about it.

See. Satellite + AI rooftop detection finds the solar the registry never captured, mapped onto grid topology, transformer ratings, and feeder load profiles.

Decide. A power-flow model computes remaining hosting capacity per block — forward-looking, driven by worst-case midday conditions.

Act. Every block gets a recommended action, not a yes/no: allow · allow with export cap · price the signal · flag for reinforcement or targeted BESS storage to soak the daytime surplus.

And before any of it exists — the same models run on grids that haven't been built yet. That's grid virtualisation, below.

Block-level hosting capacity map — each tile a feeder segment, colour showing remaining solar headroom
Block-level hosting map: not the tool that stops solar — the tool that says yes to more of it, safely.

Simulate the grid — and the power plant — before either is built.

The most expensive grid mistakes are made before ground is broken: a plant sized for demand that never materialises, feeders that saturate in five years, solar and storage bolted on after the fact. MASEMO's virtualisation layer builds a full digital twin of a planned development, district, or generation asset — a virtual grid that runs, fails, and gets fixed in simulation, before anything is committed in steel and copper.

Synthetic Demand Modelling

Socio-economic segmentation, occupancy profiles, and comparable-zone data from live deployments generate realistic hour-by-hour demand for a development that doesn't exist yet.

Virtual Power Plant & Generation Sizing

Candidate generation — plant capacity, rooftop solar, utility-scale PV, BESS — is placed into the twin and stress-tested against simulated demand, weather years, and growth scenarios.

Power-Flow & Network Simulation

Feeders, transformers, and protection are modelled and load-flowed before layout is frozen — reverse flow, voltage, and thermal limits surface in simulation, not in service.

What-If Scenarios

EV uptake doubling, solar adoption tripling, a plant unit tripping at peak — every scenario is a query against the twin, with cost and reliability consequences quantified.

Investment Sequencing

The twin ranks build order: which substation first, when storage beats reinforcement, what generation stage matches each occupancy phase — capital deployed against evidence.

Twin to Operations

When the real grid switches on, the twin doesn't retire — it becomes the live operational model MASEMO already runs, validated against actual telemetry from day one.

How an engagement runs

1

Data & Assumptions

Master plan, plot mix, comparable-zone consumption data, and generation options are locked with the planning team.

2

Build the Twin

Demand synthesis, network topology, and candidate generation assembled into a running virtual grid.

3

Simulate & Stress

Scenario batteries across weather years, adoption curves, and failure modes — with every limit and cost surfaced.

4

Deliver & Operate

A phased infrastructure plan with sized generation, storage, and network — and a twin ready to become the live decision layer.

Aliera Nexus™ — the gateway that feeds the brain.

Aliera Nexus™ is a universal edge intelligence gateway that connects virtually any sensor, controller, or monitoring device into a unified AI-ready data platform. Designed to eliminate isolated data silos, it acquires, standardises, enriches, and securely streams information from diverse systems into a single, scalable architecture.

For MASEMO, that changes what an "agent" can be. With Nexus at the edge, the platform isn't limited to grid data — vehicles, traffic, air quality, and individual transformers become live participants in the same optimisation: a complete network of things the decision layer can see, predict, and act through.

1

Energy Infrastructure

Transformers, feeders, meters, charging stations, and BESS units — streamed and standardised into the decision layer.

2

Vehicles & Traffic

Vehicles as agents in the system: telematics and traffic density feeding EV siting, charging demand, and load forecasts.

3

Environment & Air Quality

Air-quality monitors and environmental sensors — proven in Aliera's national AQ network — correlated with energy and traffic patterns.

4

Industrial & IoT

Industrial equipment and IoT devices of any make, unified for cross-domain analytics, digital twins, and multi-agent decision support.

From one development to national infrastructure.

The proof of concept validates the architecture. The roadmap runs from full-city deployments with live utility integration to a national intelligence layer — one platform giving regulators, city planners, and grid operators a unified, evidence-based view. Not a product. Infrastructure.

0

Proof of Concept

Live now — 71 urban zones, 8 AI modules, real billing & GIS data. Architecture validated.

1

Full City

Full utility-jurisdiction coverage, smart-meter integration, 72-hour forecasting live across thousands of zones.

2

National

Every distribution jurisdiction covered — national grid health, solar and EV planning, and policy-grade evidence.

+

Multi-Utility

The same decision layer extended across electricity, gas, and new-development planning — one brain, many networks.

Running a network on data that can't decide?

MASEMO sits on top of what you already run — electricity or gas. Tell us about your network; we respond within 48 hours.

Schedule a Discovery Call →